DATA

Data

Bring production data in from spreadsheets, check it, fix it and allocate it, then send clean history to decline and material balance. Every change is logged, and everything goes back out as CSV, Excel or JSON.

Validation checks, with one-click fixes where safe
17
Excel formats read, plus CSV, TSV and paste
5
Measurements held per well and day
11
Export formats: CSV, Excel, JSON and the audit trail
4
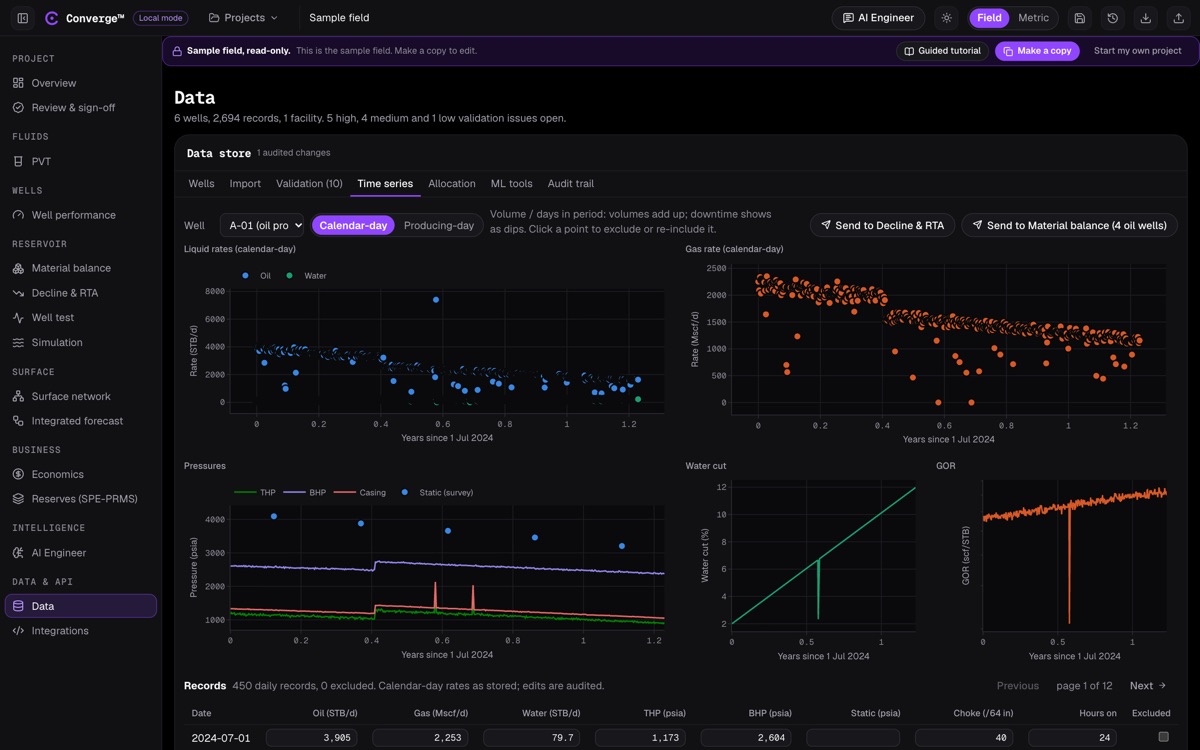
Converge data screen: daily oil, water and gas rates for one well, tubing, bottomhole and casing pressure, water cut and GOR plotted against time, with buttons to send the history to decline and material balance.
Daily history for one well: rates, pressures, water cut and GOR, ready to send to decline and material balance.

WHAT IT DOES

Clean production history, ready for engineering

Most engineering time on production data goes on cleaning it. The Data module reads the spreadsheets you already have, CSV, TSV, text or Excel workbooks, and works out what each column is: it detects the measurement and its units with a confidence and a reason, parses dates and flags mixed date orders, detects the reporting frequency and matches well names. You confirm or change any column before anything is imported.

Imported data are checked by 17 validation rules: duplicates, unit slips, spikes, flatlines, gaps, tubing pressure above bottomhole pressure, and jumps in GOR or water cut, among others. Where a fix is safe, it is one click; where two rows disagree, you choose which to keep. Allocation then distributes measured totals by well test and hours on, with BS&W and shrinkage corrections.

Clean history goes straight to Decline & RTA and Material balance. Machine-learning tools flag anomalies and estimate rates where meters are missing, and the audit trail records every change.
At a glance

  • CSV, TSV, text and Excel import, or paste
  • Automatic column, unit and date detection
  • Long, single-well and wide layouts
  • Monthly volumes converted to calendar-day rates
  • 17 validation checks
  • One-click fixes where safe
  • Allocation by well test and hours on
  • BS&W and shrinkage corrections
  • Anomaly detection and virtual flow metering
  • Audit trail of every change
  • Send to Decline & RTA and Material balance
  • CSV, Excel and JSON export

KEY CAPABILITIES

Import, check, allocate and hand on

Import

Read the files production teams actually send.

  • Paste, CSV, TSV and text files
  • Excel .xlsx, .xls, .xlsm, .xlsb and .ods
  • Each column detected with a confidence and a reason, and editable before import
  • Units detected and converted; dates parsed, with mixed date orders flagged
  • Frequency detection and well-name matching
  • One row per well and date, single-well, or one column per well

What is stored

The measurements engineering work needs, per well and day.

  • Oil, gas and water rates
  • Tubing-head, bottomhole, casing and reservoir pressure
  • Choke size and hours on
  • Water and gas injection
  • Stored in oilfield units, shown in field or metric

Validation

Problems found before they reach a forecast.

  • 17 issue types, ranked high, medium and low
  • Duplicates, unit slips, spikes, flatlines and gaps
  • Tubing pressure above bottomhole pressure
  • GOR and water-cut jumps
  • One-click fixes where safe; keep row n when duplicates disagree
  • Negative values block the import until confirmed

Allocation

Distribute measured totals back to the wells.

  • Allocation by well test times hours on, or by recorded rates
  • BS&W and shrinkage corrections
  • Check before you apply

Machine-learning tools

Help on sparse and noisy data, clearly labelled as such.

  • Anomaly detection by Hampel filter and change-point detection
  • Virtual flow metering by Gilbert choke and linear IPR, or a Gaussian process
  • Quick Gaussian-process forecast with P10, P50 and P90
  • Candidate ranking
  • Trained and tested on synthetic data, as the app states

Audit and export

Know who changed what, and take the data anywhere.

  • Every change to the data logged in the audit trail
  • CSV in field or metric units
  • Excel workbook with production, wells and audit sheets
  • JSON export
  • Audit trail as CSV

WORKFLOW

From a spreadsheet to a forecast

  1. Import

    Drop in a CSV or Excel file, or paste a table. Check the detected columns, units and well names.

  2. Validate

    Review the issues by severity and apply the fixes, or keep rows by hand.

  3. Allocate

    Distribute measured totals by well test and hours on, with BS&W and shrinkage.

  4. Review the time series

    Plot rates, pressures, water cut and GOR per well, and exclude points.

  5. Send on

    Send a well to Decline & RTA, or the field to Material balance.

  6. Export

    Download CSV, Excel or JSON, and the audit trail.

VALIDATION

Unit conversion checked to the second decimal

Unit handling on import is a named validation case, because a unit slip is the most expensive data error.

CheckReferenceConvergeTolerance
Unit conversion on import, 40 m³/d and 25 barg (V24)251.59 bbl/d and 377.29 psiaMatchesExact to 2 decimals

Not built yet: historian and production-database connectors, scheduled ingestion and allocation-network modelling. The machine-learning tools are trained and tested on synthetic data.

INPUTS AND OUTPUTS

What goes in, what comes out

Inputs

  • CSV, TSV and text files
  • Excel workbooks
  • Pasted tables
  • Well tests and hours on, for allocation

Outputs

  • Validated daily or monthly history per well
  • Issue list with fixes applied
  • Allocated rates
  • Anomaly flags and virtual-meter estimates
  • Audit trail

Exports

  • production_field_units.csv and production_metric_units.csv
  • converge_data.xlsx with production, wells and audit sheets
  • converge_data.json
  • audit_trail.csv
  • data.parseTable and data.validate over the REST API and MCP

FAQ

Data: common questions

What file types can I import?

CSV, TSV and text files, Excel workbooks (.xlsx, .xls, .xlsm, .xlsb and .ods), or a pasted table.

Does Converge convert units on import?

Yes. Units are detected from the headers, converted and stored in oilfield units, and shown in field or metric. The conversion is a named validation case.

What checks run on the data?

17 validation rules, including duplicates, unit slips, spikes, flatlines, gaps, tubing pressure above bottomhole pressure, and GOR or water-cut jumps, with one-click fixes where safe.

Can I get my data back out?

Yes, at any time: CSV in field or metric units, an Excel workbook, JSON, and the audit trail as CSV.

Can Converge read from our historian?

Not yet. Historian and production-database connectors and scheduled ingestion are not built; import is by file or paste, and the REST API can parse tables.

Turn your spreadsheets into clean history.